Mehmet Ergene
C2 Beaconing Detection with MDE Aggregated Report Telemetry
Microsoft has recently introduced a new telemetry feature in Defender for Endpoint: Aggregated Reports. This new telemetry provides new opportunities for detecting malicious activities. In this post, I will demonstrate how we can leverage Aggregated Reports to identify C2 beaconing activity.
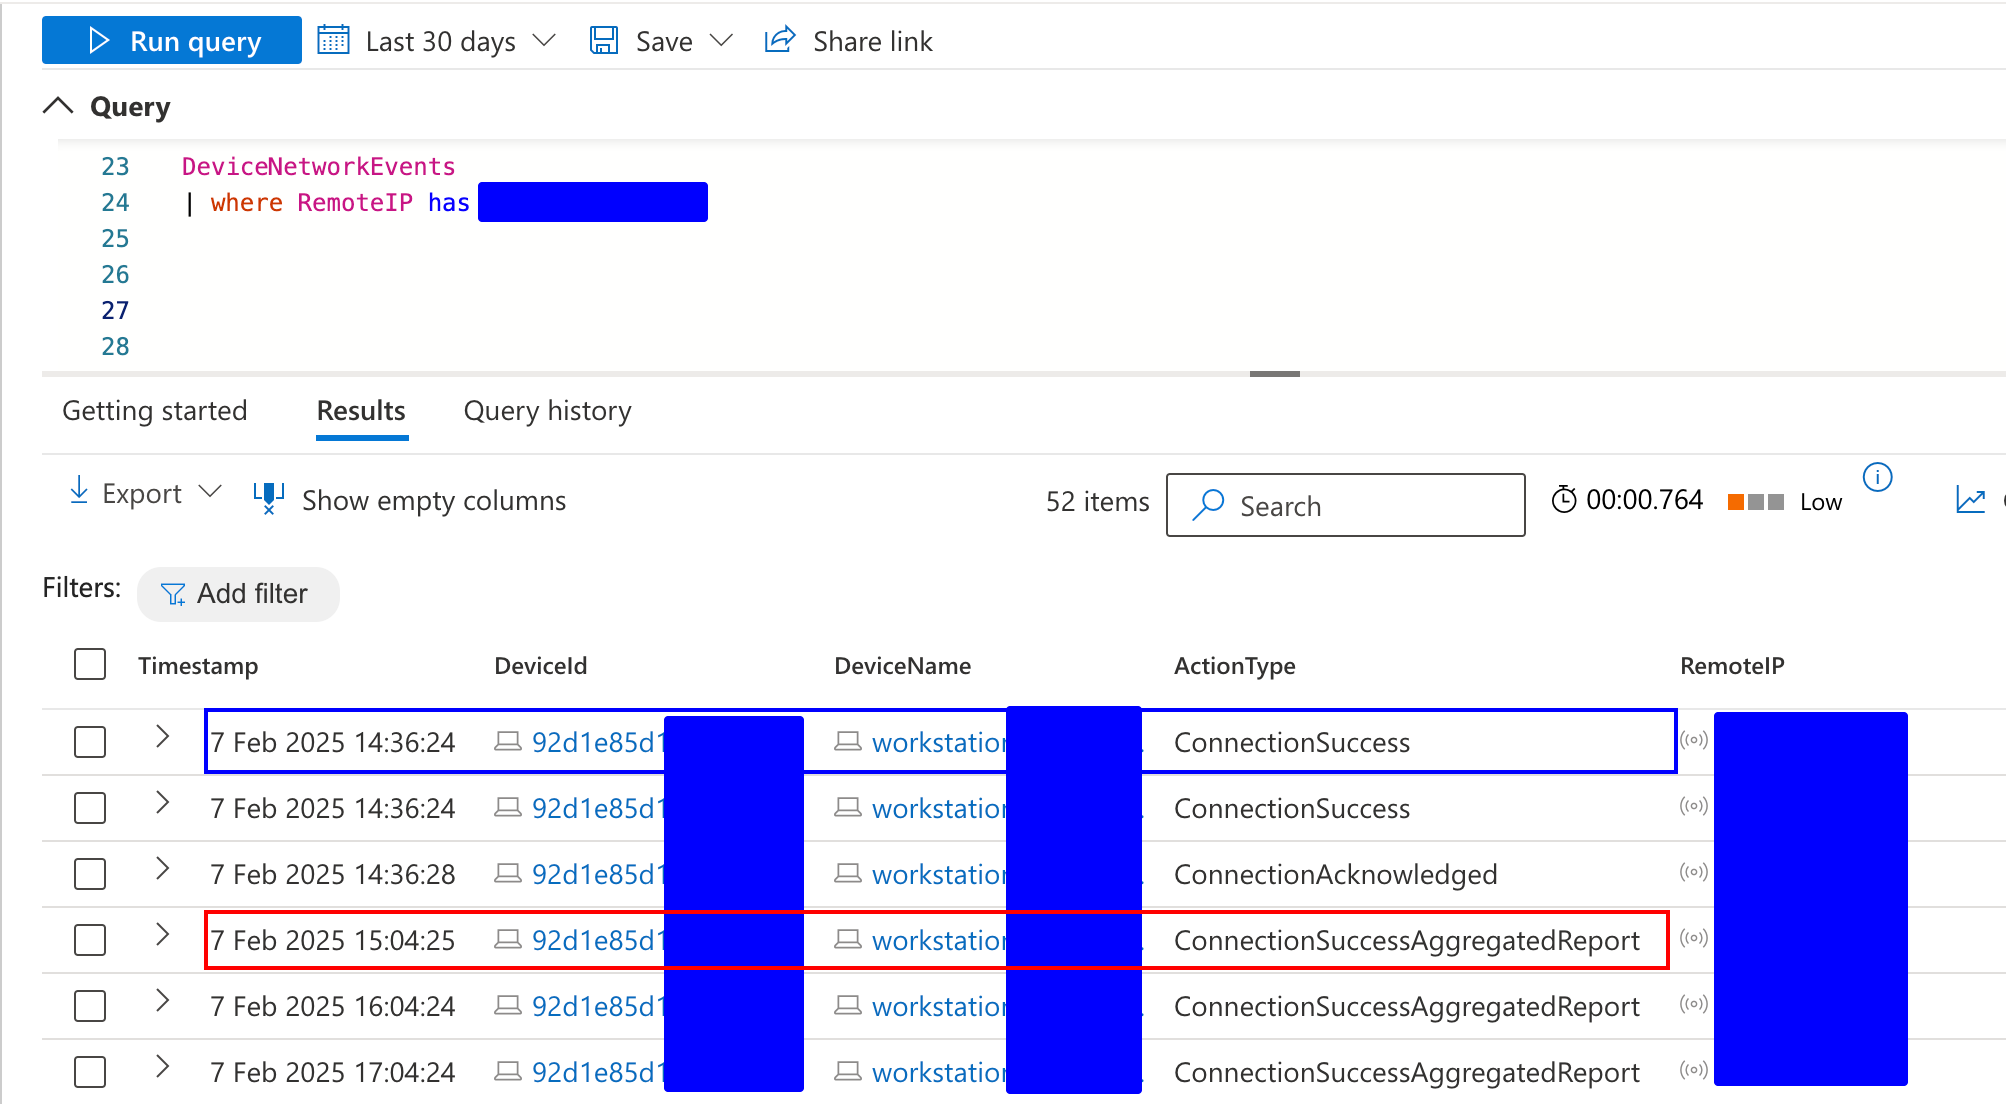
Aggregated Reports in DeviceNetworkEvents
Defender for endpoint generates two aggregated report events, ConnectionSuccessAggregatedReport and ConnectionFailedAggregatedReport, for network activity on an hourly-basis. While it's not documented when MDE starts aggregating the data, it seems like the aggregation window starts when MDE service starts. Therefore, don't expect receiving aggregated report events at the beginning of each hour.
Detecting Beaconing Activity with Aggregated Reports
Beaconing activity is typically identified by analyzing the time intervals (or time delta) between consecutive connections. The hypothesis is that beaconing follows a relatively consistent time pattern, where the time delta between connections remains uniform. While this assumption does not always hold true—especially with more sophisticated adversaries—it can be useful for detecting low/medium-profile adversaries, as well as certain periods within the beaconing activity if the adversary changes the sleep intervals during the operation.
For example, the chart below illustrates the results of running a Sliver beacon with minimal sleep and jitter. This experiment showcases typical beaconing behavior with relatively predictable time intervals.
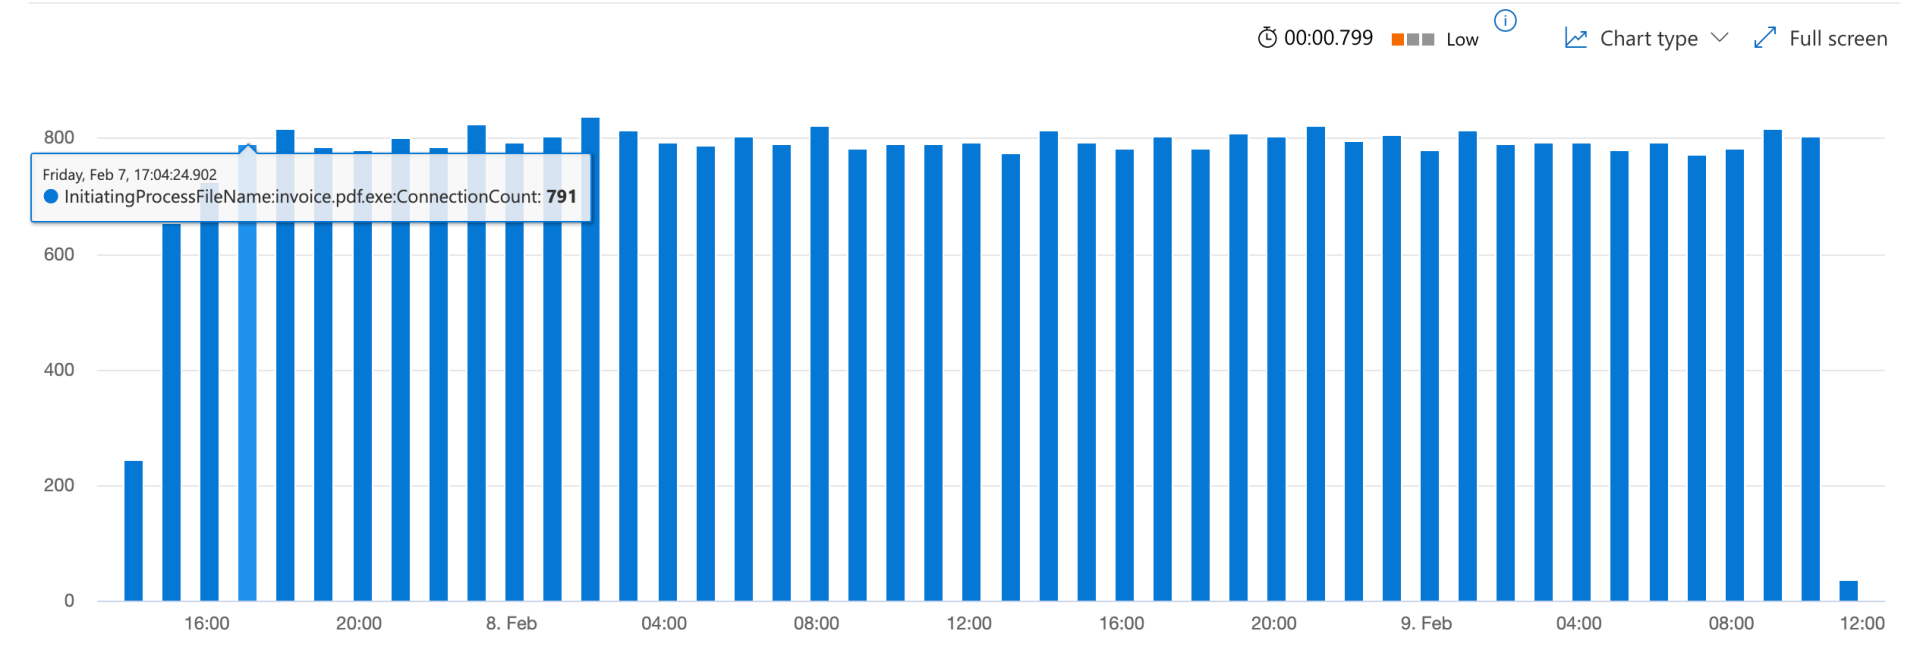
What Does Uniform Time Delta Distribution Mean for Aggregated Reports?
If beaconing activity follows a uniform time delta distribution, we can expect a consistent number of connections over specific time intervals—whether that be every hour, every 30 minutes, or other defined windows. This is where aggregated reports become highly valuable. By examining the frequency of connections over several hours (e.g., 6-hour, 12-hour, 24-hour, or 48-hour windows), we can identify patterns that indicate beaconing behavior.
However, it’s important to consider factors like device uptime and time-of-day behavior. For example, the compromised device may not be powered on continuously, or the beacon may stop communicating outside of business hours. These variations must be taken into account when building detection methods.
Developing a Detection Method
To account for these factors, I have designed a simple detection approach:
- Query 2–3 days of data.
- Identify at least four aggregated report events per day with similar connection counts.
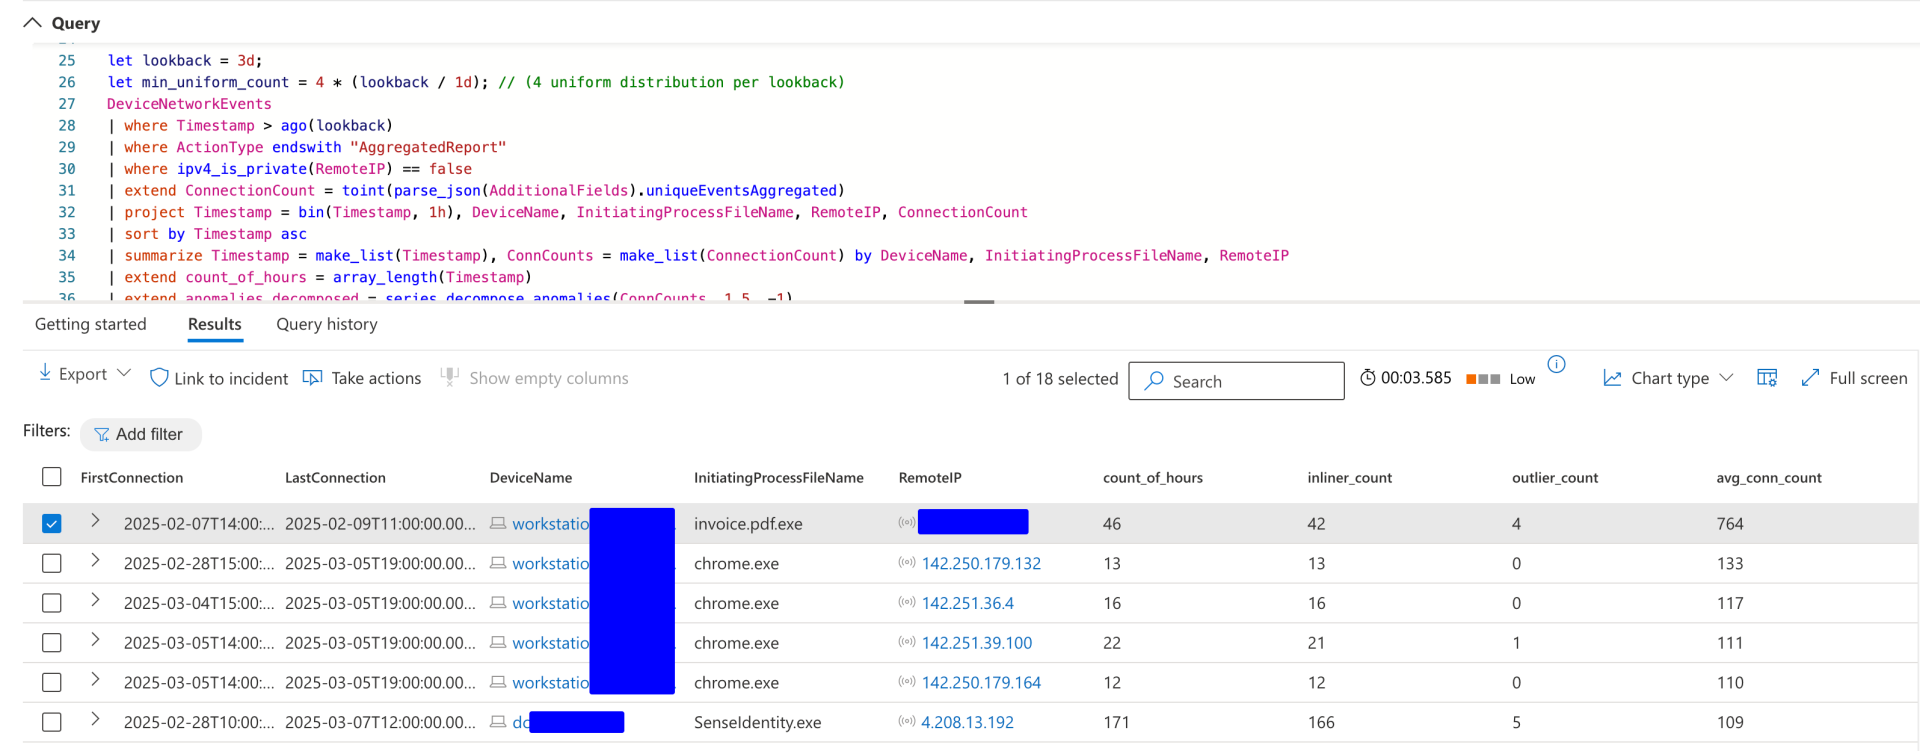
While this method is not foolproof, it provides a good starting point for detecting potential beaconing activity. Below is the query that can be used for this detection. It's also available on my GitHub repository.
let lookback = 3d;
let min_uniform_count = 4 * (lookback / 1d); // (4 uniform distribution per lookback)
DeviceNetworkEvents
| where Timestamp > ago(lookback)
| where ActionType endswith "AggregatedReport"
| where ipv4_is_private(RemoteIP) == false
| extend ConnectionCount = toint(parse_json(AdditionalFields).uniqueEventsAggregated)
| project Timestamp = bin(Timestamp, 1h), DeviceName, InitiatingProcessFileName, RemoteIP, ConnectionCount
| sort by Timestamp asc
| summarize Timestamp = make_list(Timestamp), ConnCounts = make_list(ConnectionCount) by DeviceName, InitiatingProcessFileName, RemoteIP
| extend count_of_hours = array_length(Timestamp)
| extend anomalies_decomposed = series_decompose_anomalies(ConnCounts, 1.5, -1),
        series_stats(ConnCounts)
| mv-apply anomaly = anomalies_decomposed to typeof(int) on (
                summarize inliner_count = countif(anomaly !in (-1, 1)), outlier_count = countif(anomaly in (-1, 1))
    )
| where inliner_count >= min_uniform_count and series_stats_ConnCounts_avg > 45 // avg=45 is roughly 1 min sleep with some jitter
| sort by series_stats_ConnCounts_avg desc
| extend FirstConnection = Timestamp[0], LastConnection=Timestamp[-1], avg_conn_count=toint(series_stats_ConnCounts_avg)
| project-reorder FirstConnection, LastConnection, DeviceName, InitiatingProcessFileName, RemoteIP, count_of_hours, inliner_count, outlier_count, avg_conn_count
Empty space, drag to resize
Final Thoughts
This approach is not a definitive detection technique but rather a starting point for hunting beaconing activity using aggregated reports. There is room for improvement, and I plan to implement further enhancements in future iterations.
Happy hunting!
Share

Copyright © 2026
Featured Links
Subscribe to our Newsletter!
Thank you!
New Challenge Lab
We're excited to launch our first hands-on lab challenge: Threat Hunting and Incident Response Case #001!
This lab simulates a real-world breach with two investigation paths:
This lab simulates a real-world breach with two investigation paths:
1️⃣ Incident Response: Triage an initial alert and unfold the attack.
2️⃣ Threat Hunting: Start with a TTP and hunt for adversary activity.
Select your country
Please choose your country to see the correct page.